I solve problems
with data, and
now with agents.
An IIT graduate with a decade of turning complex data into clear decisions for finance, retail, IoT and hospitality teams. Lately, building AI that does the deciding too.


Courage, patience and dedication are what pull me out of my comfort zone. I am a dreamer, an optimist, and someone who believes in the process.
Years inside fast-paced startups gave me deep business and technical range in a short time. I have built alongside leaders and visionaries who take challenges head-on, and I have always been driven by the impact I can create rather than the complexity I can show off.
I can take data of any complexity and simplify the solution as far as it will go, so the result is understood, easy to interpret, and actually moves a decision forward. I lead by example, sweat the details, and care most about creating real value for the business.
I like being challenged at every step. It keeps me feeling alive, and it is usually where the most interesting problems live.
The work I enjoy most cuts across analysis, models, strategy, visualization and the data engineering that holds it all together. My default setting is to go above and beyond: curiosity, rigor, impact.
Outside of work, I am usually deep in a Fallout run on the PS5, planning a trek into the mountains, or in a long conversation about AI or economics with someone who has an interesting point of view.
Most of my work never fits in
a screenshot. Here is how it thinks.
Models, pipelines and agents instead of dashboards. These are the systems and frameworks behind the outcomes.
Agents that answer in plain English, grounded in real data.
I am building analytics agents where an orchestrator plans a question, calls the right tools through MCP, reads the raw results, and hands back a grounded answer with the chart and the next step. No hunting through dashboards.
How it worksModels that hold up once they leave the notebook.
Forecasting, recommenders, classification and NLP, built to survive production rather than win a slide. I pick the method to fit the problem, watch the gap between test and live, and ship outputs a leader can act on.
Find the leak, then prove the fix.
I map the funnel to see exactly where users fall away, then run experiments to move that one step. The deliverable is a clear call on what to ship, backed by a readout anyone can follow.
How it worksThe right message to the right customer.
I segment the base by value and behaviour, then design the channel and offer for each group. Done well, it shows up as downloads, ROI and loyalty rather than just a prettier database.
Dashboards that get opened
every morning.
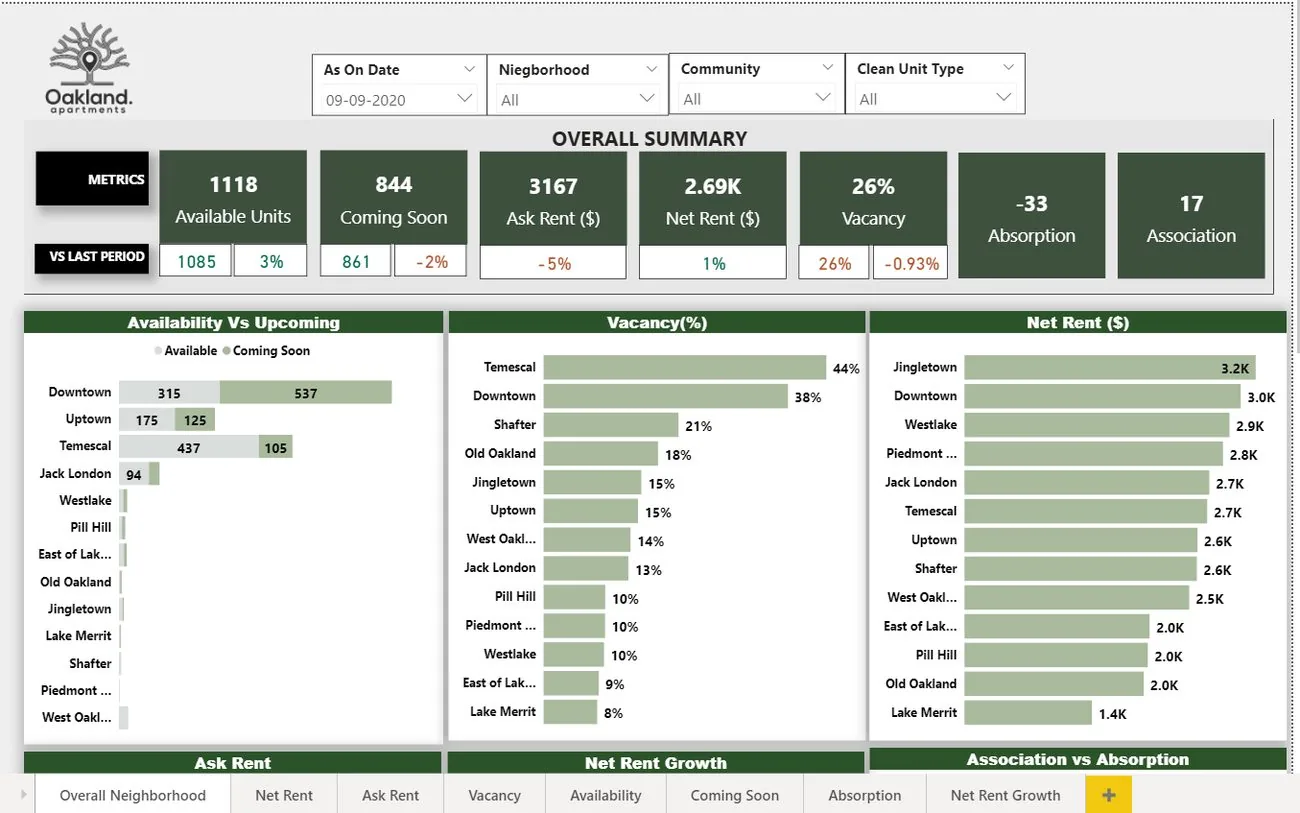
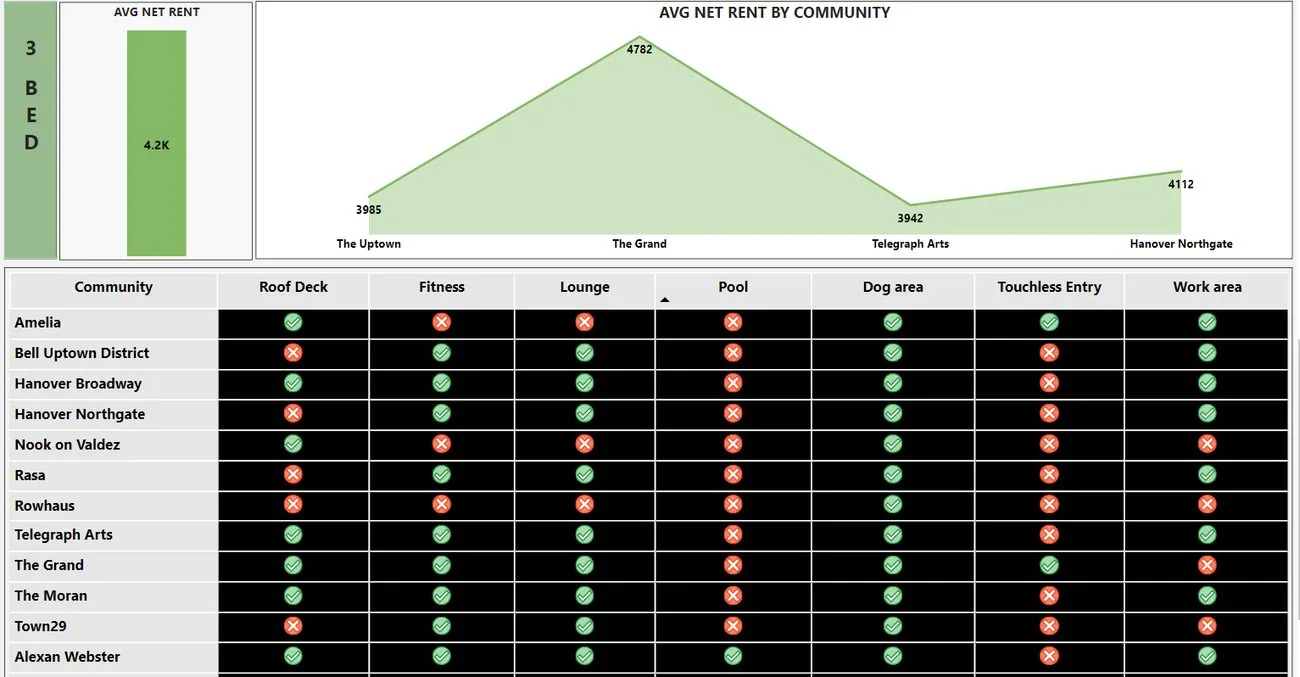
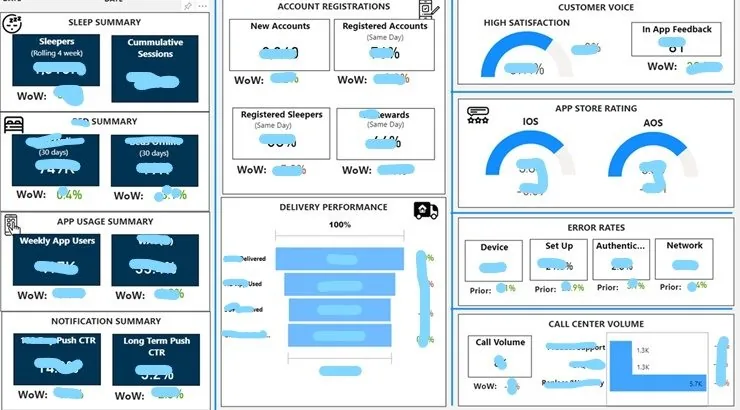
A look at the range of my visualization and analytics work. Some pieces use sample or representative data, since most of my production work cannot be shared publicly. Click any dashboard to view it full size.
Inventory velocity for a US real estate player
Executive weekly summary for a major IoT client
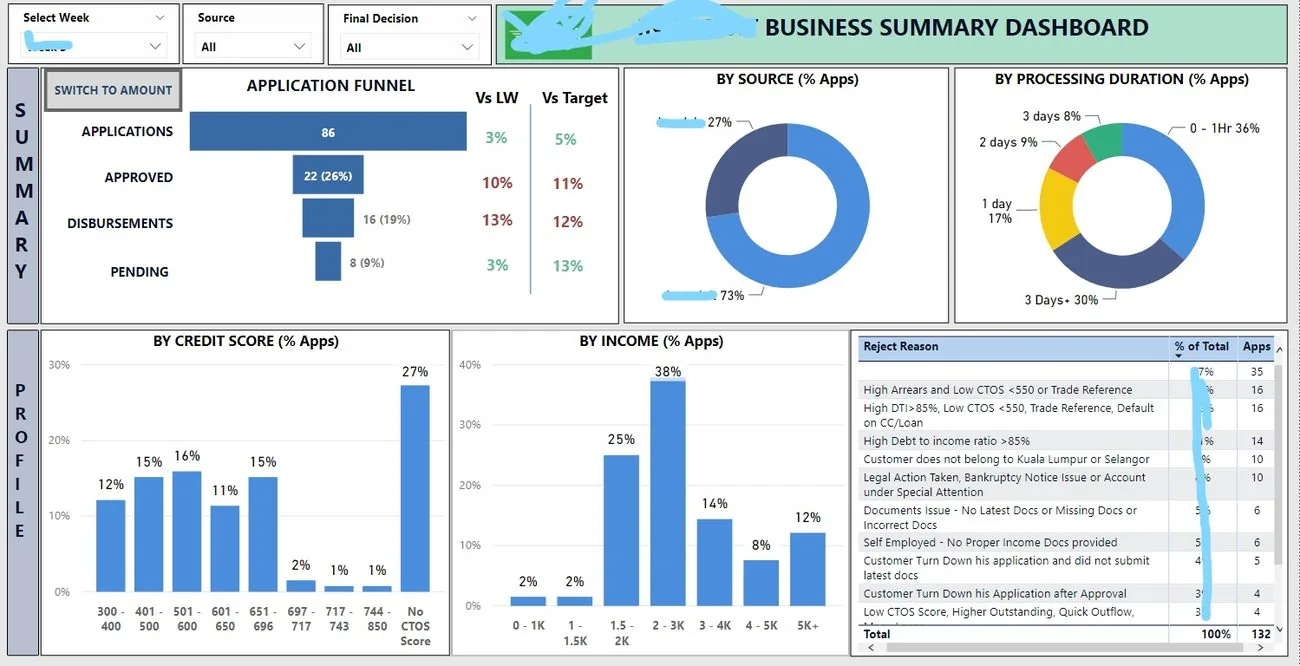
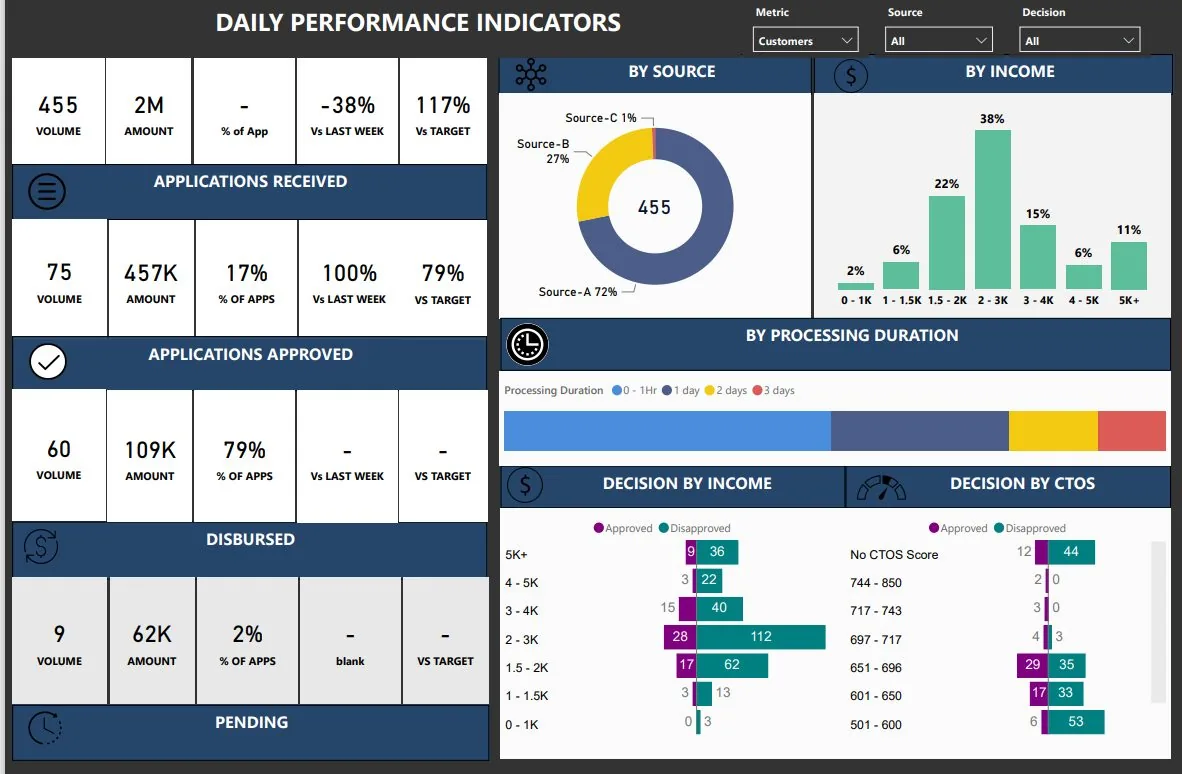
Loan origination and credit-decision monitoring
Range across pricing, growth and economics
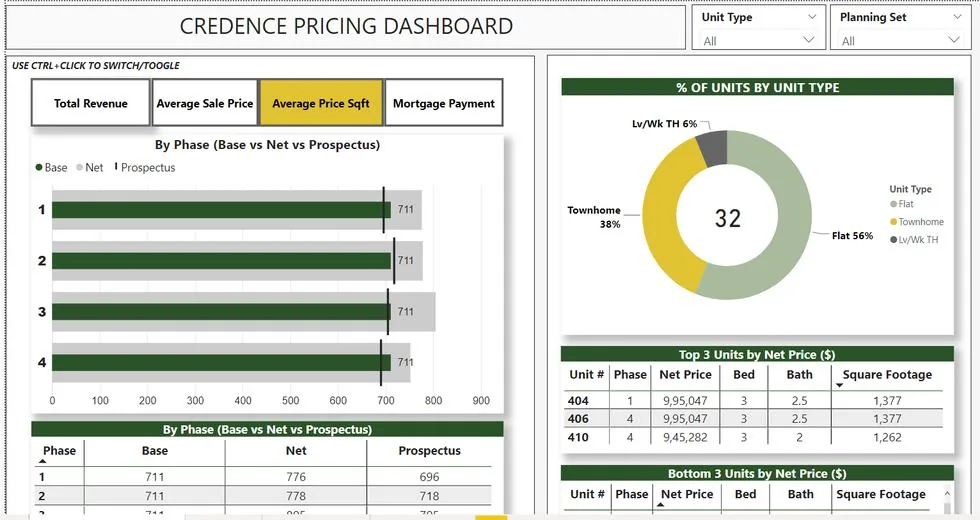
Pricing dashboard
Base vs net vs prospectus pricing by phase
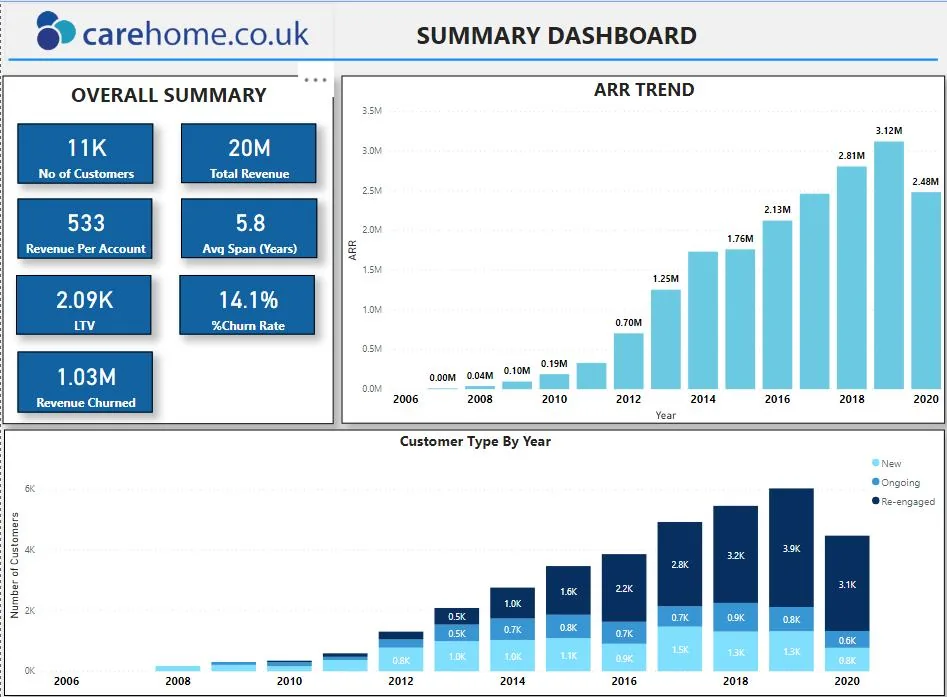
Subscription revenue and churn
ARR, LTV and customer mix over time
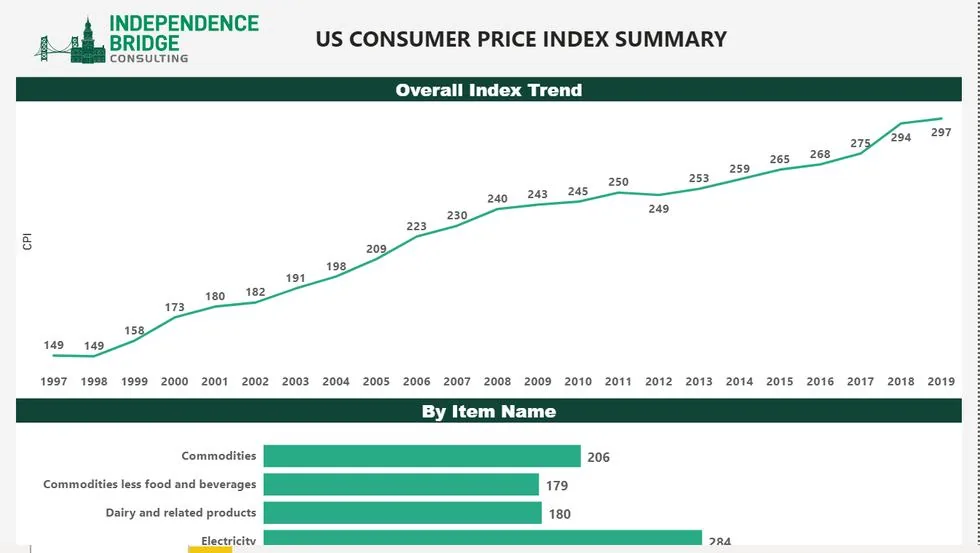
US Consumer Price Index
Long-run trend and item-level breakdown
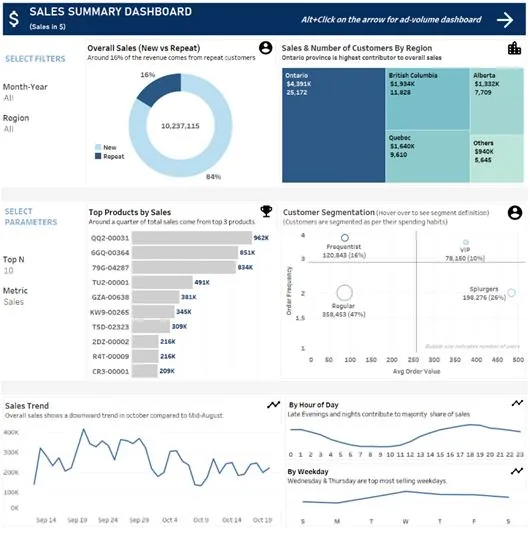
Sales summary
Regions, top products and segments
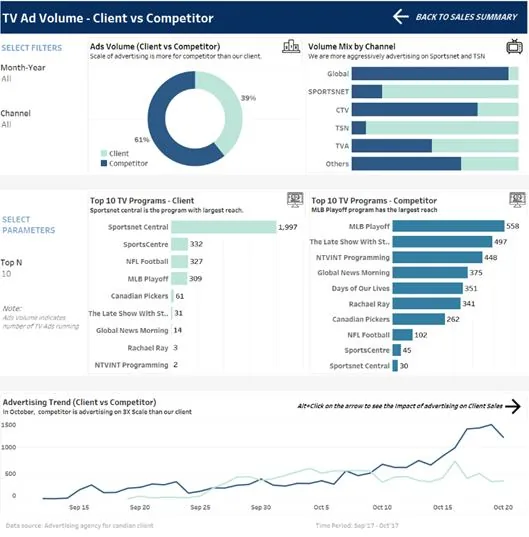
TV ad volume: client vs competitor
Share of voice and advertising trend
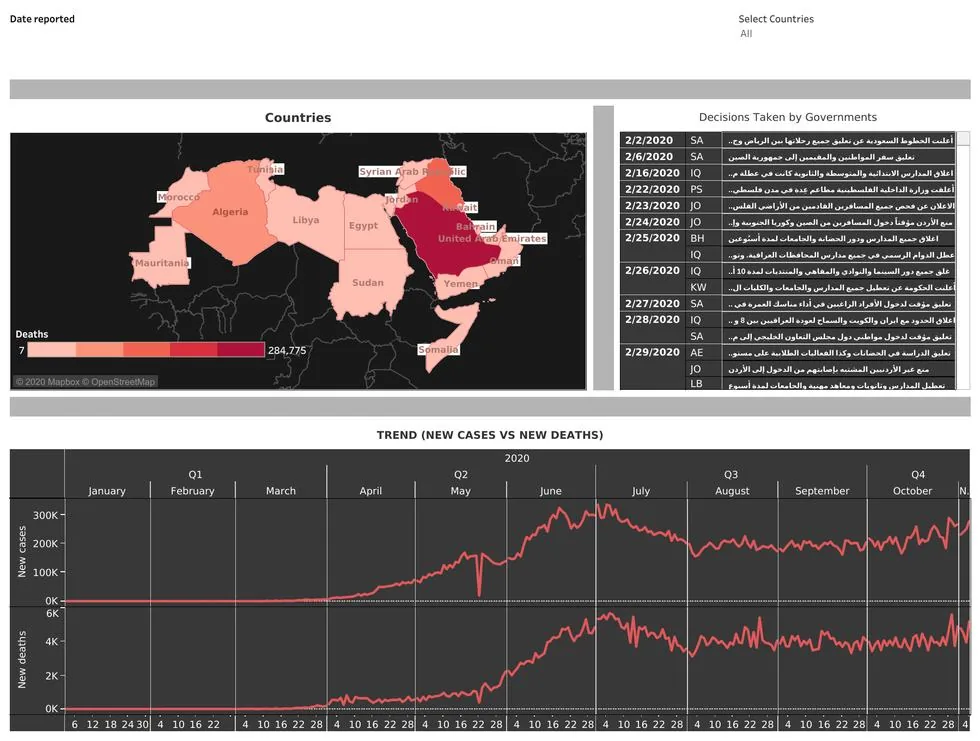
Covid cases vs government decisions
Policy timeline against case and death trends
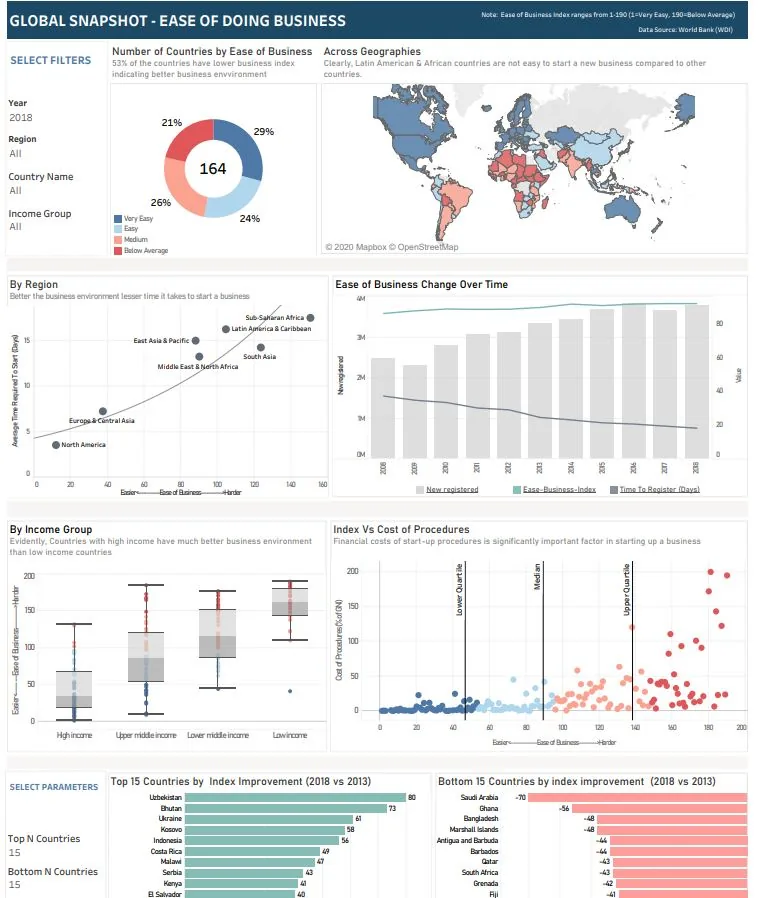
Ease of doing business
World Bank factors compared globally
A decade
in the making.
2014 to now · five roles · three industries
- Designed a holistic combined reporting system for the Global Financial Crimes program, speeding decisions for 5 teams and 150+ daily users.
- Built an investigator performance scorecard used across 10+ teams and 1000+ investigators.
- Developed a framework to find automation and efficiency opportunities across the CI ecosystem.
- Maintain a demand-forecasting model for headcount planning, and monitor 10+ A/B tests a month.
- Now building multi-agent AI tooling on top of it all.
- Drove app active users from 38% to 49% via customer analytics and targeted segmentation.
- Built a recommender system that held its accuracy from test into production and lifted basket size for the retailer.
- Designed a retailer CRM strategy: ~30K downloads, ~20% better ROI, 20% more loyalty customers.
- Processed 70TB+ in Spark-QL and ran Salesforce analyses over 100M+ rows, leading a team of 3 analysts.
- Automated performance metrics and cleaned the booking funnel by flagging fraudulent bookings.
- Built company-wide NPS monitoring and a pricing engine with the product team.
- Delivered marketing analytics and automated reporting for global brands.
- Developed customized web services and enhanced client solutions deployed on Cordys.
He challenges the conventional methods and is always thinking out of the box to help the team build better business solutions. I have nothing but great words for him and the value he brings.
Let's build something
that ships.
Open to senior and staff roles, and to consulting across analytics, AI, data, product and process work. If you have a problem that cuts across a few of these, let's talk.